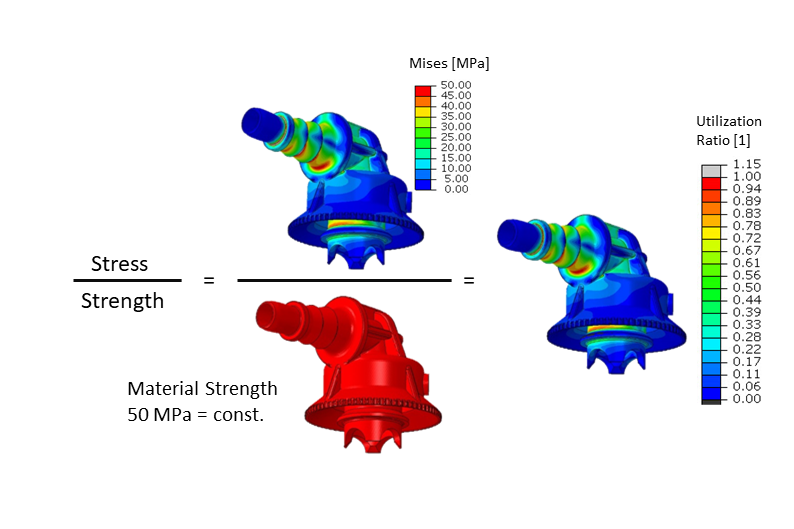
Essentially, two values are needed to make a statement about the local degree of utilization at a position of a component. One is the locally acting stress and the other is the strength of the material. The quotient of these two values provides the degree of utilization, to which a safety factor can be added, depending on the problem. For stresses below the strength, the utilization factor is less than one and failure can be ruled out.
While the determination of stresses (or strains) in a loaded component is the focus of FEM simulation and seems to be the central result, the strength is often taken as a constant value from a data sheet. With this approach, the qualitative course of the stress ratio on a component always looks exactly like the stress distribution itself (see Figure 1). The point of highest stress is always the point that is evaluated as most critical.
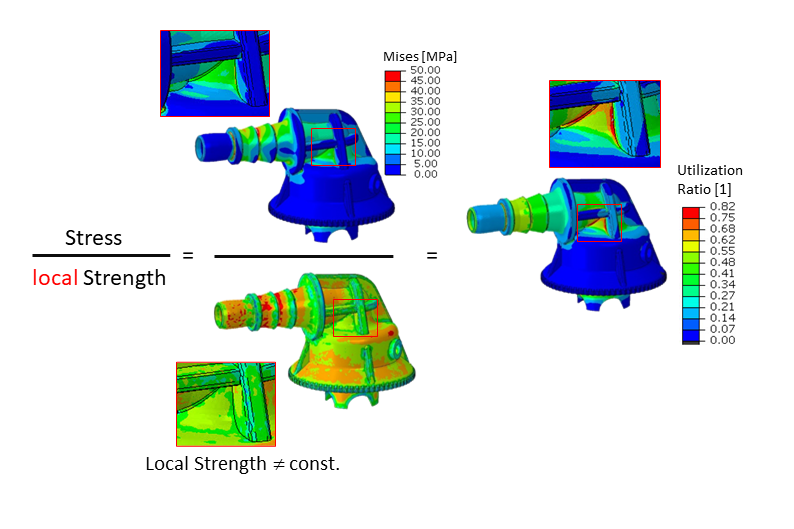
In reality, however, the component strength can vary over the component for various reasons. Local fiber orientation, the stress state, media contact, flaws or weld lines can cause the strength to take on different values at different points of the component.
Figure 2 shows the result of a strength evaluation in which the local component strength was taken into account. The contour plot of the stress ratio is clearly different from that of the stress distribution. The most critical position for the component is not the one with the highest stress, but the one with the highest utilization ratio.
A major cause of local strength reduction can be weld lines. When the melt fronts flow together again behind an obstacle or due to concave flow fronts, a potential weak spot is created. The value of the local weld line strength depends on a number of factors.
In addition to the material itself, the temperature at the time the weld line is formed and the angle at which the flow fronts meet, the flow processes after the weld line is formed and the local packing pressure curve also play an important role. Thus, weld lines at the end of the flow path generally exhibit comparatively lower strength. Ultimately, however, the value of the weld line strength cannot yet be predicted based on simulation results. The influences are too many. Nevertheless, the value can be rough guessed, or conservatively estimated from tensile tests on specimens gated on both sides.
For the development process, it is already a considerable added value to be able to recognize the weld lines in the simulation result. This means that the mere sorting of the corresponding finite elements into element sets, with the possibility of showing and hiding them and evaluating them separately, is a great help to the developer. The effort of the weld line mapping is minimal with our software Converse. The two FE models for injection molding and structural simulation are available anyway, and most injection molding solvers provide the weld line positions free of charge for each simulation.
Assigning a separate material model for these elements significantly expands the possibilities. With the appropriate software (e.g. S-Life Plastics), these areas can then be assigned a reduced strength and the weld line influence can thus be made directly visible in the evaluation.
In the development process, the additional knowledge gained can then lead to a shift in the gating point or to a modified design of the component, if required.
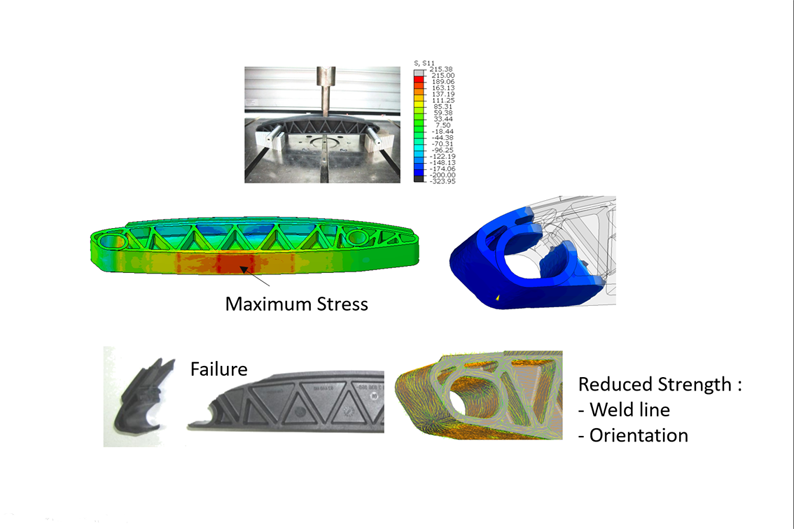
shows a component subjected to bending loads with the expected stress distribution. The usual procedure would be to compare the maximum stress with the material strength. The failure pattern clearly shows how erroneous this estimation can be when weld lines are involved.
It should be noted that this is a component with fiber reinforcement. Due to the specific, parallel alignment of the fibers in the weld line, the potential weak point in the component can already be seen without weld line mapping when using Converse (top left). In the stress evaluation, however, it is still below the maximum.
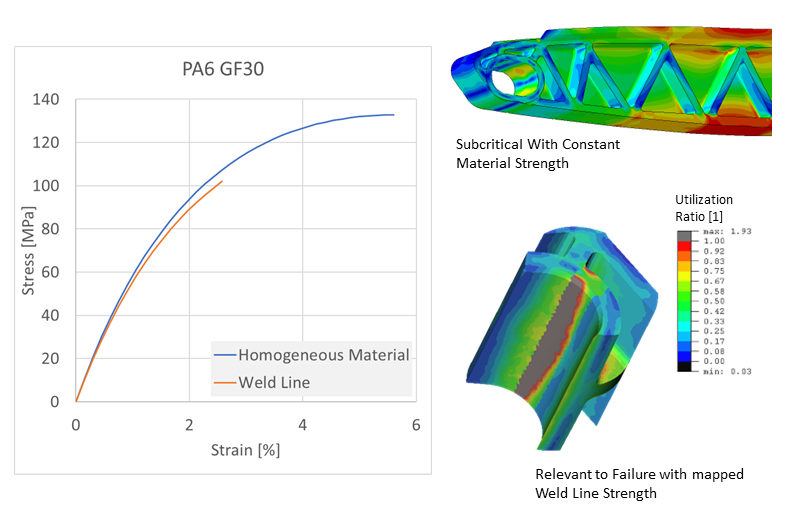
Figure 4 shows an example of the weld line strength measurement on a tensile bar, injected from both sides. The almost unchanged stiffness and the early failure due to the weak point are clearly visible. In the right part of the picture, the result of a strength evaluation with S-Life Plastics is displayed, once without (top) and once with (bottom) the use of local weld line strengths. In this case, the consideration of weld line strength in S-Life was implemented by specifying a weld line factor for all weld line zones based on the measurement shown.
Author
Dr. Marcus Stojek, Managing Director at PART Engineering GmbH, Bergisch Gladbach