Motivation
In the simplest case of cyclic strength assessment, the component is subjected to a time-varying load that oscillates with constant amplitude around a constant middle load. Assuming a linear problem, one extreme position of the load is usually represented in the FEM simulation, and the local stresses for the other extreme position can be calculated via the specified load ratio R (alternating, pulsating, etc.). The cyclic assessment is then carried out with the stress amplitudes and mean stresses calculated between these to extreme values.
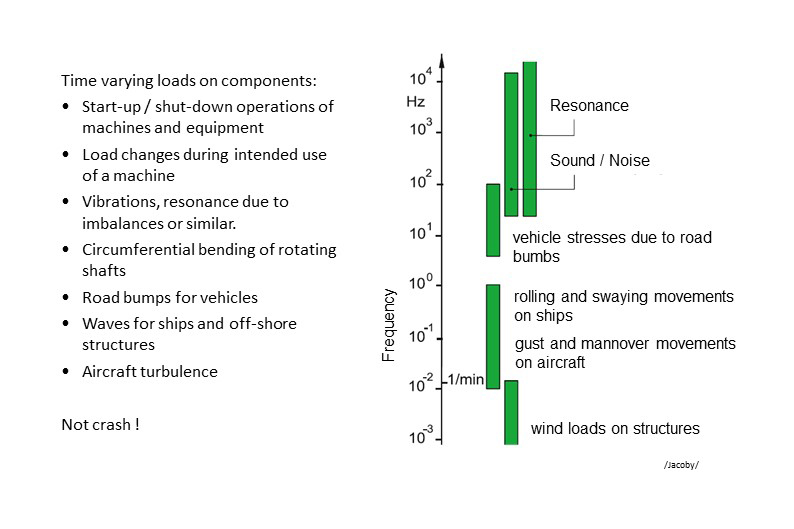
In real applications, however, amplitudes and mean stresses are often not constant, but change over the service time of the component. Reasons can be, for example, different operating conditions (loading, conveying pressure, emergency operation, idling,...), changed boundary conditions (route, load due to wind and waves, etc.)(see Figure 1) or simply time-varying loads. Load spectra are used to describe this effect quantitatively and then to process it in the assessment.
A (load) spectrum indicates how often a certain load level occurs in the time period under consideration. The load heights are usually collected (classified) in discrete load levels and normalized to the maximum value. The corresponding structural simulation for a cyclic assessment is then performed for the highest occurring load, the stresses for other spectrum levels can be determined by scaling.
In order to work with load spectra, the user must deal with three topics, which will be briefly described below:
- The determination of spectrum for the load situation at hand.
- The implementation of the load situation in the FE simulation
- The use of the determined load spectra in the strength assessment
Generation of Load Spectra
In principle, the occurrence of certain load events has to be counted to determine a load spectrum. Usually, the counting results are subsequently classified in order to reduce the amount of data and make it accessible for the calculation. Figure 2 (top) shows an assumed load curve. For example, the event to be counted could be defined as the reaching of a local load maximum. The horizontal lines in the diagram represent possible classes, the numbers at the load peaks then the counting per class.
For the presented approach, however, the counting result would be independent of the height of the respective lower extreme points in the load curve. From the information "4 load peaks in class x", however, no load or stress amplitudes or the associated mean values can be determined. Additional information regarding the spectrum is then required.
Probably the most relevant method for evaluation is the so-called Rainflow Counting, which counts closed load cycles in the load curve. The description of the exact procedure would go beyond the scope of this article. Please refer to the countless web articles on this topic. The counting can be done one-parametrically, then only amplitudes are counted, or two-parametrically, then amplitudes per mean stress are evaluated (Rainflow Matrix). The one-parametric counting can be used when additional assumptions can be made about the spectrum. For example, it can be a spectrum with constant mean stress or with constant stress ratio.
In the FKM such amplitude spectra are used. The representation and notation always refers to the max. amplitude value, normalized to 1 (see Figure 2, bottom). This normalized amplitude is plotted against the exceedance frequency. A pure sinusoidal load is represented in this diagram as a rectangle (fullness measure v=1). Counting the exceeding frequency means that the cycle number for a given amplitude always includes all cycles of lower amplitudes. In other words, these load spectra always have a decreasing shape.
With the so-called norm spectra, the FKM offers a series of load spectra in parameterized form. A distinction is made between binomially distributed and exponentially distributed spectra. In both cases, the spectrum coefficient p must be specified as a parameter. For a value of p=0, both sprectrum forms change into a one-level spectrum.
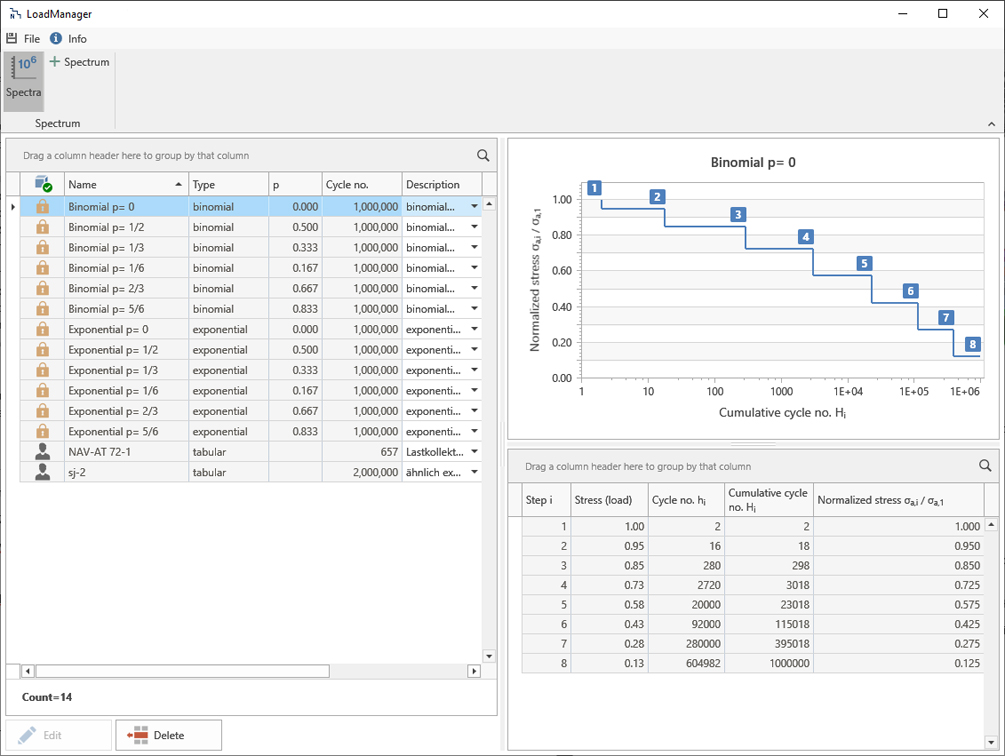
In addition to these standard spectra, user-specific spectra can also be created in the new version of S-Life and used in the assessment (see Figure 3).
hi is here the observed number of the respective load height, Hi the corresponding cumulated value, or the so-called exceeding frequency for the load height.
In order to be able to perform an assessment for a given amplitude spectrum, the mean stress per amplitude must be known. The FKM guideline assumes that a specified spectrum is a stress ratio spectrum, i.e. all amplitudes have the same stress ratio. Other types of spectra must first be converted to a stress ratio spectrum for the assessment. This is done automatically in S-Life.
Structural Simulation and Load Spectra
The concept of using spectra for the fatigue assessment assumes that the specification of the stress level for one spectrum level (usually the highest) is sufficient to be able to determine the stress for all other spectrum levels. In other words, external load and stress at the assessment point must be linearly dependent.
Linear-elastic material behavior must therefore be assumed, as well as geometric linearity (small deformations). Furthermore, there must be no change in contact conditions in the load range under consideration.
Attention must also be paid to the consideration of preloads (e.g. assembly, weight load, operating pressure, etc.) in correlation with cyclic loads. Here, the maximum stress (from static preload + alternating load) and the stress amplitude (only from the alternating load) must be carefully distinguished. This can be done either when defining the load sequence in the FE simulation, or with the appropriate settings in S-Life (subtract preload, peak-to-peak load cases).
As a last important point, dynamic effects have to be considered. A scaling of the stress with the load is no longer possible, if e.g. resonance or inertia effects play a role.
Usage of Load Spectra for the Fatigue Assessment
SN curves are used to describe the cyclic material strength. These are measured in tests on single-stage spectra (sinusoidal load) with different mean stresses. For a single-stage spectrum, the service life N associated with the amplitude can be read off as load cycles directly on the x-axis at the intersection with the SN curve. For multi-stage spectra, on the other hand, a so-called damage or damage accumulation approach is used (e.g. a method according to Miner).
Figure 4 shows an example of a SN curve and a three-stage amplitude spectrum with a total of N-overline load cycles. A run of the first spectrum stage with n1 cycles does not yet lead to failure here. As shown schematically in the diagram, the first spectrum stage could be repeated several times until the SN curve drawn in is reached at N1 load cycles (note logarithmic scaling of the x-axis). The number of possible spectrum repetitions is thus x = N1/n1 (integer). Assuming a linear damage accumulation over the number of load cycles, with x possible repetitions of the stage, a damage fraction of 1/x = n1/N1 can then be assigned to each individual run of the stage.
This procedure is repeated for different amplitudes and the damage percentage determined in each case is added up until the limit value of 1 (Miner sum) is reached. The evaluation of the stress amplitudesthat are lower than the fatigue strength and the consideration of possible preliminary damage by the individual spectrum stages distinguishes the different Miner methods (Miner elementary, Miner consistent, etc.).
Since SN curves are usually determined for a purely alternating load (R=-1), the load spectra to be verified must be converted to this stress ratio in order to apply the described procedure. S-Life can automatically perform these conversions for mean stress spectra in the assessment.
With the new LoadManager, S-Life offers a convenient option to consider the load profiles relevant for the respective application in the FKM assessment. If such spectra are to be determined by the user, the counting method used and the type of evaluation must be carefully checked. Furthermore, it must be ensured that the corresponding FE simulations allow to determine the stress amplitudes even if static preloads act on the component. All subsequent steps are performed automatically by S-Life during the assessment.
Author
Dr. Marcus Stojek, Managing Director at PART Engineering GmbH, Bergisch Gladbach, Germany